hd_geom_pie() creates a pie geometry layer that is added to an hd()
object via +. The layer records the geometry type and any geometry-specific
arguments; rendering only happens when the hd object is printed.
Arguments
- inner_size
A string specifying the inner radius of the pie as a percentage of the total radius. For example, "50%" creates a donut chart with a hole in the middle. The default "0%" creates a standard pie chart. This argument is only applicable to the Highcharts backend; it is ignored by ggplot2 since it does not support donut charts.
- value_suffix
A string to append to the labels on the pie slices. Default is "%".
- ...
Geometry-specific arguments forwarded to
hd_make().
Examples
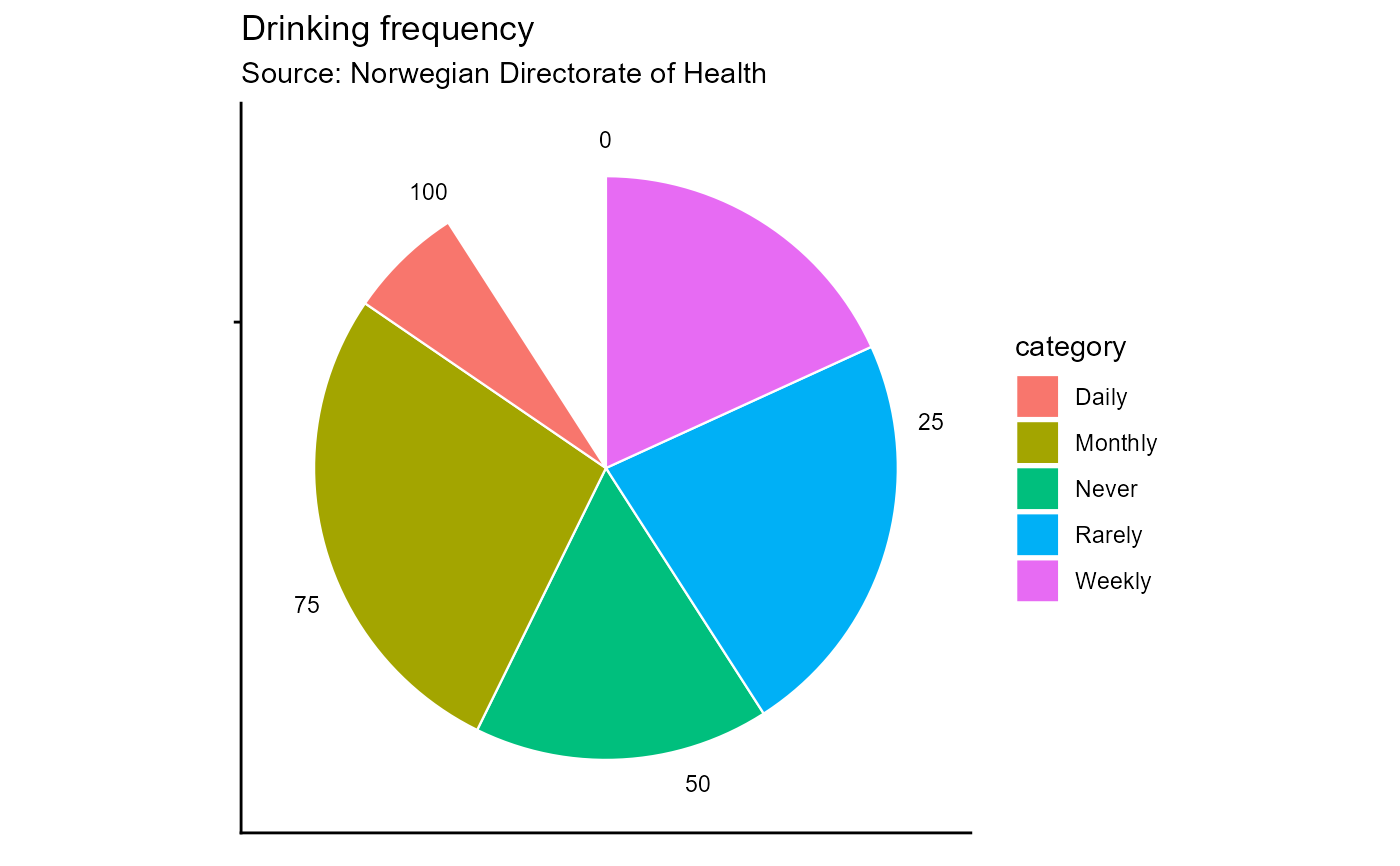
# Category share dataset (pie)
drinking_freq <- data.frame(
category = c("Never", "Rarely", "Monthly", "Weekly", "Daily"),
pct = c(18, 25, 30, 20, 7)
)
spec_pie <- hd_spec(drinking_freq,
x = "category",
y = "pct"
)
opts_pie <- hd_opts(
title = "Drinking frequency",
subtitle = "Source: Norwegian Directorate of Health",
ylab = "Share (%)"
)
# Donut interactive
hd_make(spec_pie, "pie", opts_pie, inner_size = "50%")
# Composable API style (ggplot2 ignores inner_size)
hd(drinking_freq, x = "category", y = "pct", backend = "static") +
hd_geom_pie() +
hd_opts(
title = "Drinking frequency",
subtitle = "Source: Norwegian Directorate of Health"
)