Geometry layer for ribbon / confidence-interval charts. Unlike the other
hd_geom_*() functions, ymin and ymax are required named arguments
(they map to column names in spec$data) rather than optional ... extras.
This makes the contract explicit at the call site instead of burying
required information inside ....
Examples
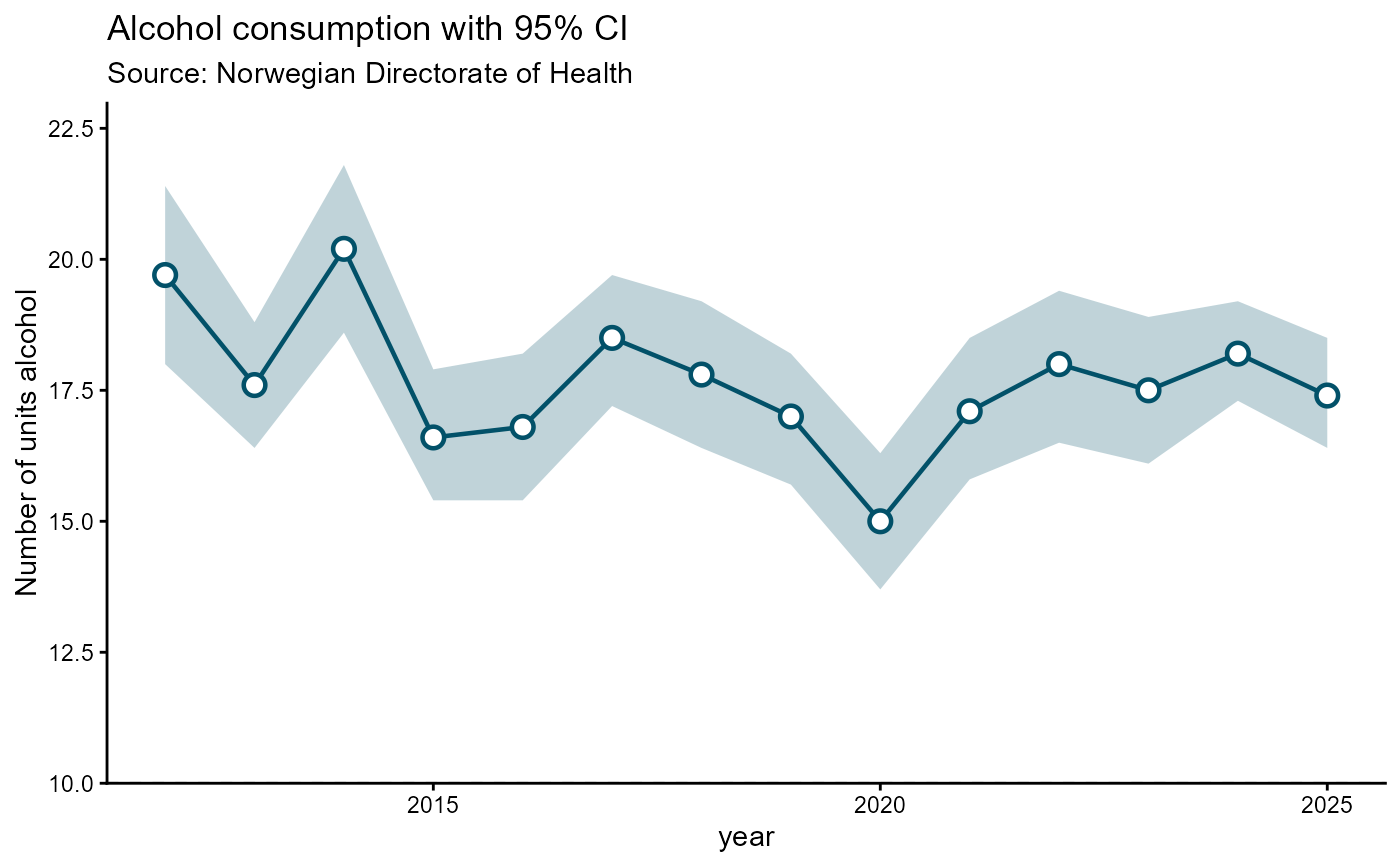
# Single series
spec_ar1 <- hd_spec(alco1,
x = "year",
y = "adj_enhet")
opts_ar <- hd_opts(
title = "Alcohol consumption with 95% CI",
subtitle = "Source: Norwegian Directorate of Health",
ylim = c(0, 30),
ylab = "Number of units alcohol"
)
hd_make(spec_ar1, "arearange", opts_ar,
ymin = "lower_enhet", ymax = "upper_enhet")
# Static ggplot2 version
hd_make(spec_ar1, "arearange", opts_ar,
ymin = "lower_enhet", ymax = "upper_enhet", backend = "static")
#> Warning: The `backend` argument of `hd_make()` is deprecated as of highdir 0.7.0.
#> ℹ Please use the `mode` argument instead.
 #' # Multi-series with group column
# Grouped by kjonn
spec_ar2 <- hd_spec(alco2,
x = "year",
y = "adj_enhet",
group = "kjonn")
hd_make(spec_ar2, "arearange", opts_ar,
ymin = "lower_enhet", ymax = "upper_enhet")
#' # Multi-series with group column
# Grouped by kjonn
spec_ar2 <- hd_spec(alco2,
x = "year",
y = "adj_enhet",
group = "kjonn")
hd_make(spec_ar2, "arearange", opts_ar,
ymin = "lower_enhet", ymax = "upper_enhet")